
Ecommerce businesses generate large volumes of data related to customer behavior, marketing campaigns, and sales activity. Interpreting this data accurately is essential for evaluating business performance and identifying growth opportunities.
Ecommerce performance signals refer to measurable indicators derived from analytics data that reveal how effectively an online store converts traffic, retains customers, and generates revenue. Platforms such as Shopify provide built-in analytics dashboards that help merchants monitor these signals and evaluate store performance.
This article provides a neutral analysis of ecommerce performance signals, explaining:
- what ecommerce performance signals are
- which Shopify analytics metrics matter most
- how businesses interpret traffic and engagement data
- how performance indicators influence strategic decision-making
Understanding these metrics allows ecommerce operators to make more informed decisions and respond effectively to changing market conditions.
What Are Ecommerce Performance Signals?
Ecommerce performance signals are analytics indicators that reveal how customers interact with an online store and how efficiently the business converts visitors into revenue.
These signals are typically derived from metrics such as:
- conversion rate
- average order value
- cart abandonment rate
- traffic sources
- customer retention rates
Shopify highlights the importance of these analytics metrics in its overview of ecommerce analytics and reporting tools, explaining that performance metrics help merchants identify growth opportunities and operational challenges.

Source: Shopify Analytics Guide (2026)
Monitoring these indicators helps businesses understand whether marketing efforts, product strategies, and user experience improvements are producing measurable results.
Key Ecommerce KPIs in Shopify Analytics
Conversion Rate
Conversion rate measures the percentage of visitors who complete a purchase.
It is one of the most widely used ecommerce performance indicators because it reflects the effectiveness of the sales funnel.
According to checkout usability research from the Baymard Institute’s ecommerce studies, a significant portion of ecommerce carts are abandoned before checkout completion, indicating that many conversion problems occur during the checkout process.
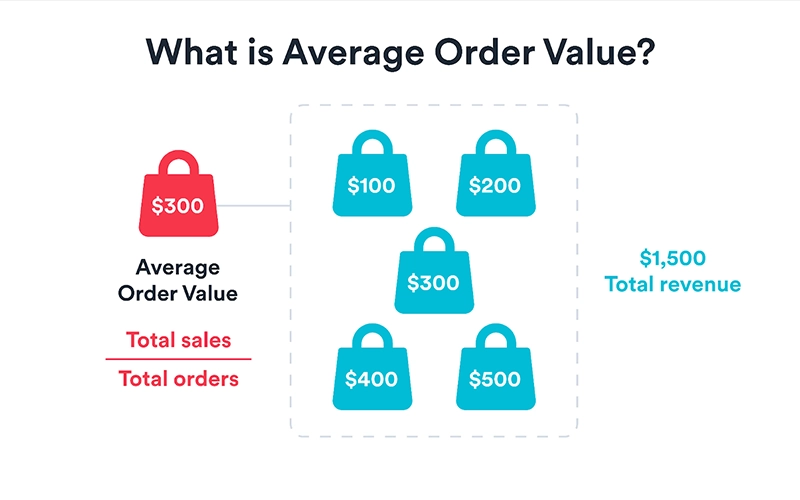
Average Order Value (AOV)
Average Order Value represents the average amount spent per transaction.
A higher AOV often indicates successful upselling, product bundling, or pricing strategies.
Increasing AOV can improve revenue even if overall traffic remains unchanged.
Cart Abandonment Rate
Cart abandonment rate measures the percentage of shoppers who add items to their cart but leave without completing the purchase.
Common causes include:
- unexpected shipping costs
- complicated checkout processes
- limited payment options
Understanding abandonment behavior helps businesses identify friction in the purchase journey.
Customer Acquisition Cost (CAC)
Customer Acquisition Cost measures the amount spent to acquire a new customer through marketing activities.
Balancing CAC with customer lifetime value is important for sustainable growth.
Marketing analytics platforms often evaluate which acquisition channels produce the most cost-efficient results.
Customer Lifetime Value (CLV)
Customer Lifetime Value estimates the total revenue a customer generates over the duration of their relationship with a business.
Research discussed in Harvard Business Review’s analysis of customer retention suggests that improving customer retention can significantly increase long-term profitability.
Traffic and Visitor Engagement Metrics
Understanding visitor behavior helps businesses evaluate the effectiveness of marketing strategies and website usability.
Traffic Source Analysis
Traffic sources reveal how visitors arrive at an ecommerce store.
Common traffic sources include:
- organic search
- paid advertising
- referrals
- social media
Insights from Google’s Think with Google consumer behavior research show that understanding the customer journey across channels is critical for improving marketing effectiveness.
Analyzing traffic sources helps businesses identify high-performing marketing channels.
Bounce Rate and Session Duration
Bounce rate measures the percentage of visitors who leave the site after viewing only one page.
Session duration measures how long visitors remain on the site.
A high bounce rate combined with short sessions may indicate issues with:
- page relevance
- website usability
- page loading speed
Improving these factors often increases visitor engagement.
New vs. Returning Visitors
The ratio of new visitors to returning visitors provides insight into customer loyalty and brand engagement.
Returning visitors often indicate stronger brand recognition and customer satisfaction.
Monitoring this ratio helps businesses evaluate the effectiveness of retention strategies.
Conversion Metrics and Sales Funnel Analysis
Conversion metrics provide insight into how effectively a store turns visitors into customers.
Conversion Rate Optimization
Conversion rate optimization involves analyzing customer behavior and testing changes to improve the purchasing experience.
Common optimization methods include:
- A/B testing page layouts
- improving product descriptions
- simplifying checkout flows
These changes can significantly improve conversion performance.
Cart Recovery and Checkout Optimization
Businesses often address cart abandonment by implementing strategies such as:
- reminder emails
- simplified checkout processes
- transparent pricing
These improvements help reduce friction in the purchase journey.
Average Order Value Optimization
Increasing AOV can be achieved through strategies such as:
- product bundling
- cross-selling complementary items
- discounts for higher purchase thresholds
These strategies increase revenue without requiring additional traffic.
Customer Behavior and Retention Metrics
Retention metrics provide insight into long-term customer relationships.
Repeat Purchase Rate
Repeat purchase rate measures how many customers return to make additional purchases.
A high repeat purchase rate often indicates strong customer satisfaction and loyalty.
Customer Retention Analysis
Retention strategies may include:
- personalized marketing campaigns
- loyalty programs
- targeted email communication
These strategies aim to strengthen customer relationships and increase lifetime value.
Product Performance and Inventory Signals
Product analytics help businesses understand which products contribute most to revenue.
Best-Selling Products
Identifying top-performing products allows businesses to focus marketing efforts and inventory planning on items with strong demand.
Inventory Turnover
Inventory turnover measures how quickly products sell relative to available stock.
Monitoring turnover helps businesses avoid overstocking or stock shortages.
Global ecommerce market research from Statista’s online retail industry analysis shows continued expansion in ecommerce markets, making inventory optimization increasingly important.
Example: AI-Driven Ecommerce Analytics Platforms
Some ecommerce analytics tools combine data analysis with automated marketing and customer engagement features.
For example, Akohub AI Retargeting & Loyalty for Shopify integrates with Shopify to support marketing automation strategies such as retargeting campaigns, referral programs, and loyalty systems.

Platforms in this category apply analytics insights to customer engagement and retention strategies.
Interpreting Ecommerce Performance Signals
Businesses often translate analytics signals into strategic actions.
Common approaches include:
- identifying bottlenecks in conversion funnels
- optimizing marketing channel allocation
- adjusting pricing and product positioning
- improving website usability
Regular monitoring allows businesses to respond quickly to performance changes.
FAQ: Ecommerce Performance Signals and Shopify Analytics
What are ecommerce performance signals?
Ecommerce performance signals are analytics indicators that reveal how effectively an online store converts visitors into customers and generates revenue.
Which Shopify metrics are most important for ecommerce analysis?
Commonly used metrics include conversion rate, average order value, cart abandonment rate, customer acquisition cost, and customer lifetime value.
Why are traffic metrics important for ecommerce?
Traffic metrics help businesses understand where visitors originate and how they interact with the website, which helps optimize marketing strategies.
How do businesses use Shopify analytics data?
Businesses use analytics data to evaluate marketing campaigns, identify product trends, improve user experience, and optimize conversion rates.
Can analytics tools automate ecommerce insights?
Some analytics platforms apply machine learning to analyze customer behavior and generate insights that support marketing automation and customer engagement strategies.
Conclusion
Ecommerce performance signals provide valuable insight into how online stores attract, convert, and retain customers. By monitoring Shopify analytics metrics such as conversion rates, traffic sources, customer retention, and product performance, businesses can better understand their operational strengths and challenges.
Analyzing these metrics regularly allows ecommerce operators to identify trends, diagnose performance issues, and make informed strategic decisions. As ecommerce markets continue to expand, effective interpretation of analytics data will remain an essential capability for sustainable online growth.
Try Akohub for FREE today and start building your loyalty program today! Reach out to us at service@akohub.com or book a free consultation here:


