
In ecommerce, product pages are a critical point in the conversion funnel. For Shopify stores, product page performance directly influences conversion rates, customer engagement, and overall revenue outcomes.
However, high traffic does not always translate into sales. Many product pages receive consistent visits but show weak engagement or low conversion. These patterns indicate underperformance signals, which can reveal gaps in user experience, pricing alignment, or content effectiveness.
Understanding these signals allows businesses to diagnose issues systematically and improve product page outcomes through data-driven adjustments.
What Signals Show That a Shopify Product Page Is Underperforming?
A Shopify product page is considered underperforming when it fails to convert traffic into meaningful user actions such as:
- adding products to cart
- initiating checkout
- completing purchases
Key signals typically include:
- low conversion rate
- low add-to-cart rate
- high bounce rate
- declining traffic
- weak engagement metrics
Shopify outlines the importance of tracking these ecommerce indicators in its guides, emphasizing the role of data in diagnosing store performance.
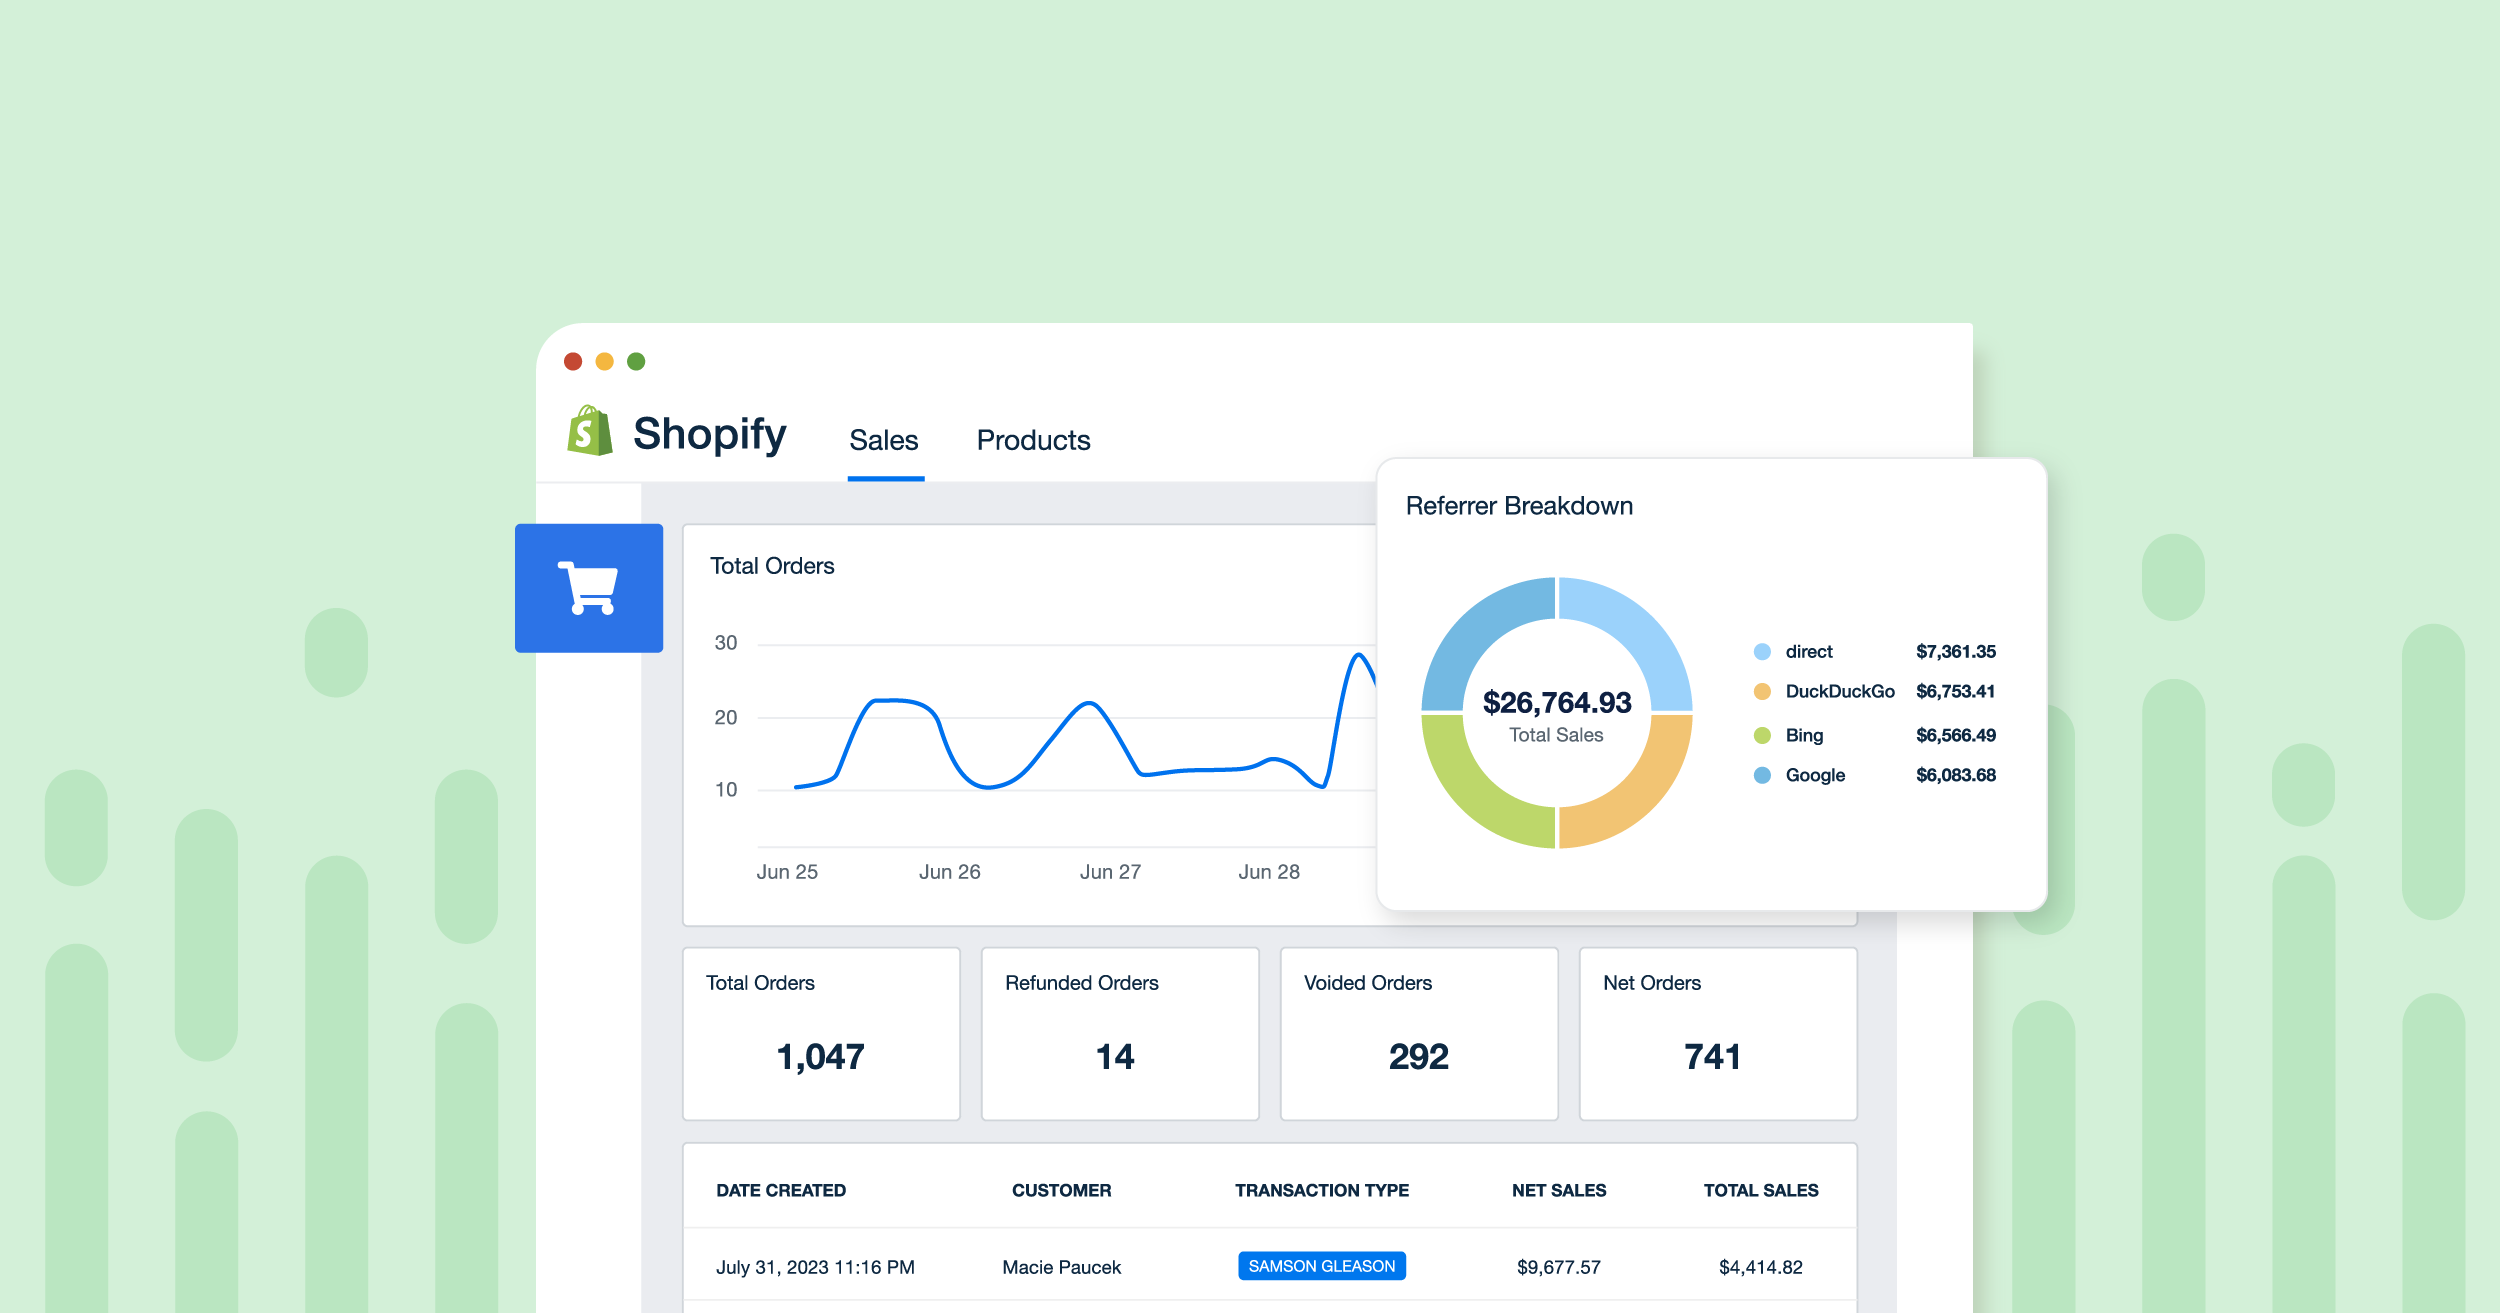
Image source: Agency Analytics
How Are Product Page Performance Signals Defined?
Product page performance signals are quantitative and behavioral indicators used to evaluate how users interact with a product listing.
These signals fall into four categories:
- Traffic signals – visibility and visitor volume
- Engagement signals – how users interact with the page
- Conversion signals – purchase-related actions
- Operational signals – post-purchase outcomes
Each category provides insight into different stages of the ecommerce funnel.
How Are Shopify Product Page Signals Used in Industry Analysis?
Businesses use performance signals to:
- identify friction in the customer journey
- evaluate marketing effectiveness
- optimize product presentation
- improve conversion rates
Research shows that companies using structured performance metrics are more likely to improve operational efficiency and customer outcomes.
Similarly, industry analysis highlights how behavioral data improves conversion performance when applied correctly.
What Are the Key Performance Signals of an Underperforming Product Page?
Low Traffic Volume
Low or declining traffic suggests visibility issues.
Common causes include:
- weak SEO performance
- ineffective marketing channels
- poor internal linking
Traffic acquisition insights show that relevance and intent alignment significantly impact visibility.
Low Conversion Rate
Conversion rate measures the percentage of visitors who complete a purchase.
A low rate often indicates:
- misaligned product messaging
- pricing concerns
- lack of trust signals
Low Add-to-Cart Rate
Add-to-cart rate reflects purchase intent.
A low rate may indicate:
- unclear value proposition
- ineffective call-to-action
- insufficient product information
High Bounce Rate
Bounce rate measures how many visitors leave without interaction.
High bounce rates often indicate:
- mismatch between traffic and content
- poor page design
- slow loading speed
According to SEMRush, high bounce rates are often associated with poor content relevance.

Short Session Duration
Short sessions suggest low engagement.
Users may leave quickly if:
- content lacks clarity
- visuals are insufficient
- page does not meet expectations
Negative Customer Feedback
Customer reviews provide qualitative signals.
Negative feedback may indicate:
- product quality issues
- misleading descriptions
- delivery or service problems
High Return and Refund Rates
High return rates often reflect mismatches between expectations and actual product experience.
Data shows that returns are a major cost factor in ecommerce operations.
What Technologies Are Used to Monitor Product Page Performance?
Analytics Platforms
Tools such as Shopify Analytics and Google Analytics track:
- traffic sources
- conversion funnels
- user behavior

Behavioral Analytics Tools
Behavior analytics tools provide:
- heatmaps
- session recordings
- click tracking
These tools help visualize user interaction patterns.
SEO and Performance Tools
SEO tools evaluate:
- keyword relevance
- page visibility
- technical issues
Performance tools monitor:
- page load speed
- mobile responsiveness
How Are These Signals Applied Strategically in Ecommerce?
Improving Product Content
Clear descriptions and structured information help users evaluate products more effectively.
Enhancing Trust Signals
Adding reviews, ratings, and transparent policies improves credibility.
Reducing Friction
Simplifying navigation and checkout processes improves conversion rates.
Aligning Traffic with Intent
Targeting high-intent users improves both engagement and conversions.
Example: Tools Supporting Customer Engagement
Some ecommerce tools combine analytics with customer engagement strategies.
For example, Akohub AI Retargeting & Loyalty for Shopify integrates with Shopify to support retargeting, referral programs, and loyalty systems.
Platforms in this category use behavioral data to improve retention and conversion outcomes.

Limitations and Considerations
While performance signals provide useful insights, there are limitations:
- metrics may vary by industry and traffic source
- correlation does not always imply causation
- external factors (seasonality, competition) can influence data
Accurate interpretation requires combining multiple data points rather than relying on a single metric.
Future Trends in Product Page Optimization
Increased Use of AI Analytics
AI systems are increasingly used to:
- detect behavioral patterns
- predict conversion likelihood
- automate optimization
Real-Time Personalization
Dynamic content personalization is becoming more common in ecommerce.
Cross-Channel Data Integration
Combining data from multiple channels provides a more complete view of customer behavior.
FAQ
What are the main signs of a Shopify product page underperforming?
Low conversion rate, low add-to-cart rate, high bounce rate, and weak engagement are common indicators.
Why does a product page get traffic but not sales?
This often results from mismatched user intent, unclear product value, or friction in the purchase process.
How can product page performance be measured?
Performance is measured using metrics such as conversion rate, engagement metrics, and funnel drop-off analysis.
What tools are used to analyze product page performance?
Analytics platforms, behavior tracking tools, and SEO tools are commonly used.
Can improving product pages increase revenue without more traffic?
Yes. Improving conversion efficiency can increase revenue from existing traffic.
Conclusion
Shopify product page underperformance is typically identified through a combination of traffic, engagement, conversion, and operational signals.
By systematically analyzing these indicators, businesses can identify inefficiencies in product presentation, user experience, and marketing alignment.
Continuous monitoring and data-driven optimization enable ecommerce stores to improve conversion performance and better translate traffic into revenue.